Independent and Dependent Variables Explained
Students taking the SAT and ACT should be prepared for the tests to mention independent and dependent variables. It’s important, therefore, to know the difference between the two. In this article, we’ll discuss the difference between an independent and a dependent variable, and we’ll consider a few hypothetical experiments in order to identify the independent and dependent variable in each. Finally, we’ll discuss how independent and dependent variables should be represented on a graph. Let’s take a look!
What’s a Variable?
Before we discuss the difference between independent and dependent variables, we ought to refresh ourselves on what, exactly, a variable is. Like its name suggests, a variable is a piece of data that’s ABLE to VARY (that is, change). In algebra, we often use letters to represent variables.
Independent Variables
An independent variable is a variable whose variation does not DEPEND on another variable. It is chosen by the experimenter or exists independently of other conditions in the experiment. Time is an independent variable, for example, because time simply progresses. In a linear equation, the independent variable is X, the input variable.
Dependent Variables
Dependent variables, by contrast, DEPEND on other variables for their variation.
For example, plant height might be an independent variable, as how tall a plant grows depends on how much sunlight and water it receives. In a linear equation, the dependent variable is Y, the output variable.
Examples of Independent and Dependent Variables
Let’s consider a few hypothetical experiments and identify the independent and dependent variable in each experiment.
Experiment 1: A farmer wants to see which type of fertilizer results in the greatest crop production. He chooses three different types of fertilizer for three identical patches of soil and plants an identical number of seeds in each patch, ensuring that the seeds receive the same amount of water and light. When the plants have grown, he writes down how much the plants have produced.
In this experiment, the type of fertilizer is the INDEPENDENT variable. That’s because it didn’t depend on anything else in the experiment. The farmer simply chose it.
The DEPENDENT variable in this experiment is how much the plants produced. That’s because some plants might produce more or less depending on what fertilizer is used.
Experiment 2: A mom wants to find out which brand of paper towel is most absorbent. She chooses 5 different brands and tears off an equal size sheet of each to soak up an equal-sized amount of water. Then she measures how much water each paper towel brand absorbs.
In this experiment, the INDEPENDENT variable is the brand of paper towel. That’s because it didn’t depend on anything in the experiment. The mom selected it.
The DEPENDENT variable in this experiment is the volume of water absorbed by each brand of paper towel.
An easy way to remember independent versus dependent variables? Independent variables are what you’re trying. Dependent variables are what you’re measuring.
Graphing Independent and Dependent Variables
It’s important to understand how independent and dependent variables ought to be depicted on a graph. If you do, you’ll be able to better understand questions on the SAT and ACT Math sections, as well as the ACT science section, that involve this topic.
It’s pretty easy to remember as well.
The INDEPENDENT variable should be the label for the X axis.
The DEPENDENT variable should be the label for the Y axis.
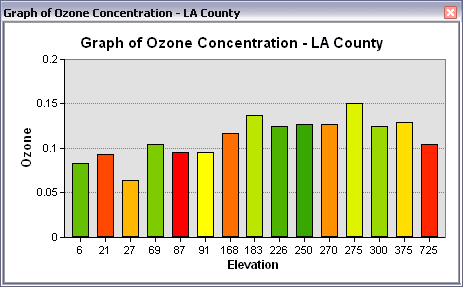
Let’s take a look at a couple of graphs:

In the graph above, the independent variable is the elevation at which ozone is measured. The dependent variable is the amount of ozone itself. Notice the independent variable is on the X axis and the dependent variable is on the Y axis.
Here’s another example:

In the graph above, the independent variable is the type of pet people might own. The dependent variable is the number of people who reported owning that type of pet. Again, notice the independent variable is on the X axis and the dependent variable is on the Y axis.
* * *
That’s it! For more SAT and ACT prep tips, as well as college admissions advice, check out the rest of our blog. Looking for 1-on-1 ACT or SAT prep tutoring? Want to join an SAT or ACT group class? Contact us today!
